2015 – The Strongest Year for Sales Since 2008
2014 was a strong and stable year with modest increases in sales activities and benchmark prices of about 5% throughout the Lower Mainland. By contrast, 2015 saw the greatest activity and benchmark price increases since 2008. 2015 has been a banner year for real estate sales with an overall benchmark price increase of 16.4% for the entire Lower Mainland. Although we don’t expect 2016 to match these levels we are still expecting a strong market. Also, before everyone starts talking about bubbles, although the price changes have been relatively large, we haven’t seen the same indicators we saw leading up to the market fall in 2008.
Let’s take a closer look.
Greater Vancouver
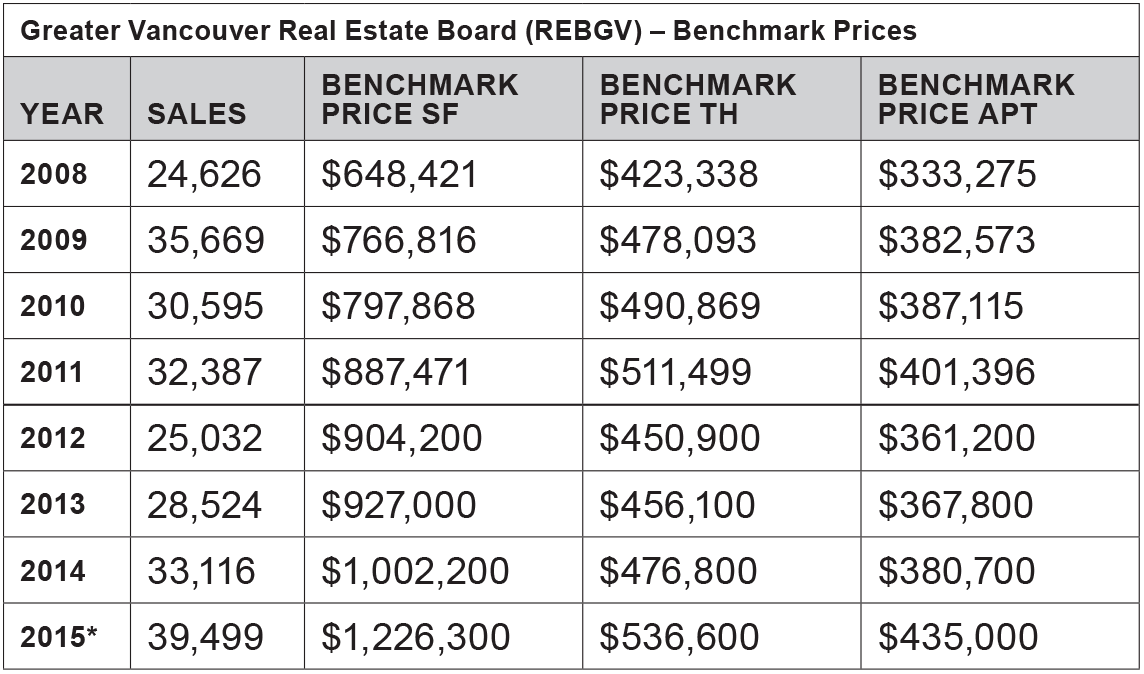
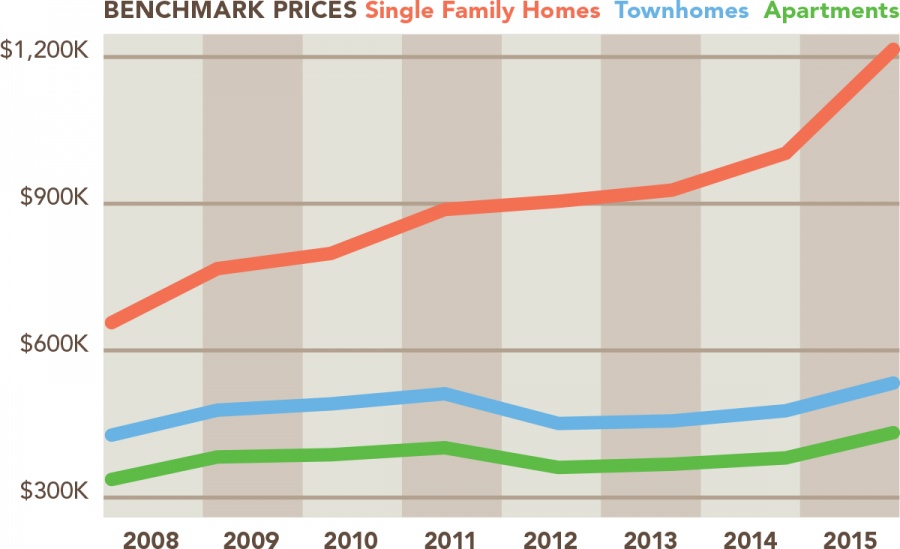
Most of you have likely heard news about our single family market increasing by over 22% throughout the lower mainland. In fact, the lowest increase was seen on Bowen Island at 9% while Tsawwassen saw the highest increase in the single family market at 31.4%. Other top performers were Vancouver (East and West), Burnaby North, West Vancouver and Ladner all around 26-27%. The Single Family benchmark price for Greater Vancouver is now $1,226,300 representing a 22.6% increase and a whopping 106.8% over 10 years. With ever limiting supply (especially as more houses are turned into higher density) this market shows no signs of falling in the foreseeable future.
Apartments and Townhomes also saw strong increases although roughly half of the single family market. Townhomes saw an 11.3% increase in benchmark prices with the strongest performers on the eastside of Vancouver, Richmond, Port Moody and even Maple Ridge. East Burnaby and New Westminster saw the smallest increases at 0.5% and 2.5% respectively although all regions showed increases. Apartments saw a 14% increase in benchmark price in 2015 with top performers in West Vancouver and East Burnaby at around 19.5% followed closely by the westside of Vancouver and Port Moody. Maple Ridge and Pitt Meadows were the slowest areas for apartment sales and saw the only negative price changes at -1.4% with all other regions being positive.
Fraser Valley
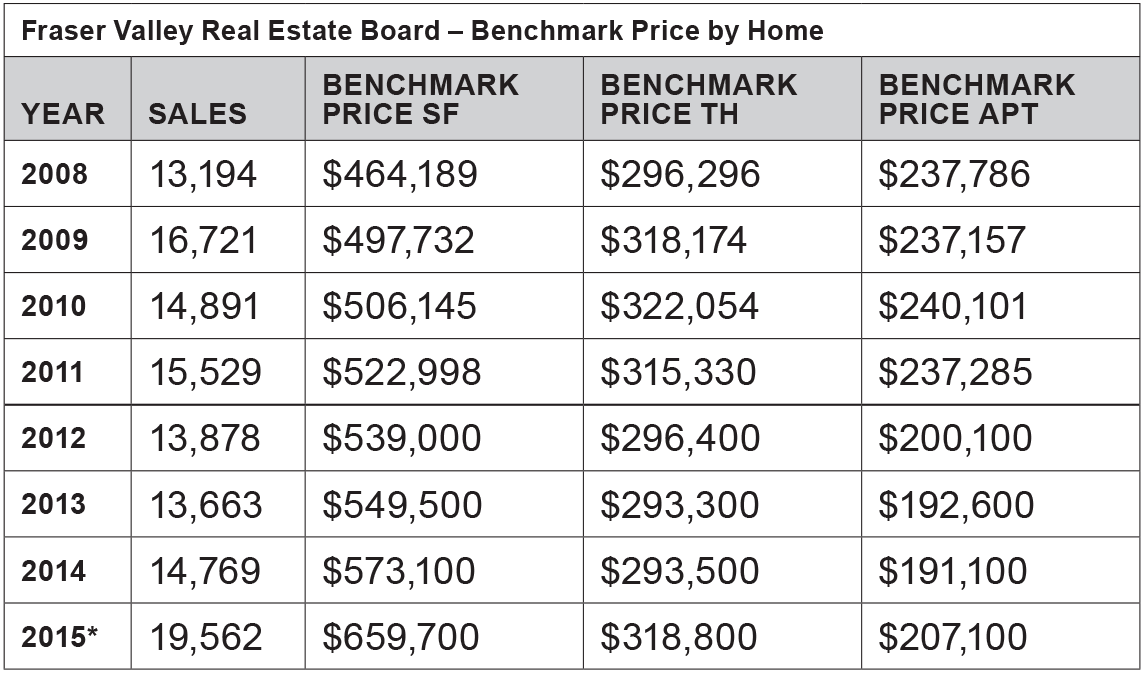
The Fraser Valley also saw a strong year with positive benchmark price increases in all areas across all product types. Although last year saw some inconsistency across neighbourhoods, 2015 was far more stable and consistent. The single family market saw an overall 14.7% benchmark price increase with North Delta and North Surrey being the top performers at roughly 21% and Abbotsford being the smallest increase at 10.3%. The townhouse market saw a 6.7% overall benchmark increase with North Delta again being the highest at 9.6% and South Surrey/White Rock being the smallest increase at 2.7%. In apartment sales there was a strong 9.3% overall increase with Mission surprisingly being the highest increase at 15.5% and Abbotsford being the smallest at 2.5%.
So before we all hit the panic button and wait for the bubble to burst, it is important to note that overall averages are pulled up by the single family market which continues to dwindle. It is expected that the single family market is going to continue to increase at strong levels because there is still a great deal of demand and very limited supply. In the townhouse and apartment sector, price increases have been more modest and the large jump really is reflective of only 2015. If large increases continue for a sustained period of time we could see some correcting but other economic factors also play a role.
2015 Year-End Wrap Up – Metro Vancouver by MAC Marketing Soluction
Recent Comments