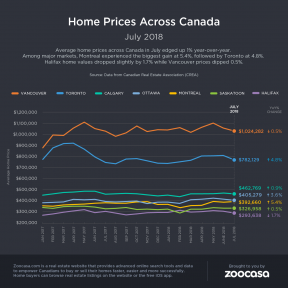
National home sales and prices improved this July, after a shaky first half of the year. Average prices edged up 1% year-over-year to $481,500, according to the Canadian Real Estate Association (CREA). National home sales rose 1.9% from June to July, but are down year-over-year 1.3%.
Despite this rally, rising interest rates and mortgage stress-testing continue to dampen the market. “Improving national home sales activity in recent months obscures significant differences in regional trends for home sales and prices,” said Gregory Klump, CREA’s chief economist. “Regardless, rising interest rates and this year’s stress test on mortgage applicants will likely prove to be difficult hurdles to overcome for many would-be first time and move-up homebuyers, heading into the second half of the year and beyond.”
Stress-Testing Boosting Condo Sales
OSFI, the federal bank regulator, tightened mortgage-lending rules on January 1 of this year. Borrowers must now have income that can support a mortgage of at least 5.34%, no matter their contract rate, or seek out financial institutions not regulated by OSFI, such as credit unions and private lenders. The biggest impact is seen on first-time home buyers, as their affordability is significantly reduced. Meanwhile, the biggest market consequences have been to push up activity among less expensive property types, like condos, as more expensive property types, like single-family homes, flounder.
We can see that trend this July, as condo units across the country posted the largest year-over-year price gains, at 10%, followed by townhouses and row units up 4.7%. Conversely, one-storey and two-storey single family home prices continue to decline year-over-year by 0.7% and 1.5% respectively.
More Balanced Markets
About two-thirds of all local markets were in balanced market territory in July 2018. This is calculated using a sales to new listings ratio, currently at 55.9%, close to the long-term average. That means these markets are healthy and favourable neither to the seller nor the buyer.
Still, prospective sellers are not listing their home as much. Newly listed homes are down 1.2% and are lower than they have been in at least eight years. Although there was a surge of Toronto homes for sale, it doesn’t make up for the fact that new listings are down in more than half of all local markets, including the Vancouver, Edmonton and Calgary real estate markets.
Long-Term Benchmark Home Prices Post Huge Gains
Although some Canadian markets have seen dips year-over-year, most markets are up from five years ago when we look at the benchmark prices.
The benchmark price from the MLS Home Price Index, a better gauge of movement and reflection of the market, was up 2.1% year-over-year to $634,300. Over five years, it’s up 45%.
This is the first month since April 2017, widely considered the market peak, that prices have grown year-over-year. The gains are likely due to the Greater Toronto Area rebounding from the psychological effect of the Ontario Fair Housing Plan, which included 16 measures designed to cool the market.
But when we go back, beyond April 2017, we find that almost every single market outside of oil-producing regions has posted double-digit gains.
Fraser Valley has grown the most, with prices up almost 94% from five years ago, while Regina has taken the biggest hit, with prices down 7.89%.
Check out our infographic below for the full picture of national home prices this July :
Housing Market Has Small Rally in July by Zoocasa
Recent Comments