Stephen Brown of Capital Economics isn’t the first economist to predict this month that Vancouver home prices are entering a downward spiral, but he has bolstered the prediction with a new chart.
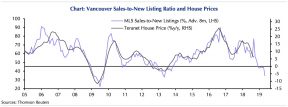
In a response to the Teranet-National Bank House Price Index published today, the senior Canadian economist for the oft-contrarian research firm plotted both the sales-to-new listings ratio and indexed Vancouver house prices dating back to 2005.
Over that period, the two have closely followed each other in terms of peaks and valleys, the chart shows.
Based on an eight-month projection for the sales-to-new listings ratio, Vancouver house prices are on course to be substantially lower by the midway point of 2019.
“The sales-to-new listing ratio points to outright falls in prices of as much as 5%,” Brown notes.
More and more homes are appearing — and staying — on the market in Vancouver lately, and there has been some speculation that many more listings are on the way.
For example, more than one economist has noted that a number of condo buildings are slated to be completed in the coming months. As contractors wrap up work on these dwellings, some of the new units will inevitably end up on the market as early investors look to part with them.
“That is going to bring lots more supply,” Steve Saretsky, the founder of VancityCondoGuide, told Livabl earlier this month. “I think it’s a huge thing that hasn’t really played out a whole lot yet,” he added.
This Chart Shows How 15 Years of Vancouver Housing Data Points to Lower Home Prices Coming by Josh Sherman | Livabl
Recent Comments