The Canadian housing market continues its long-term recovery, as sales and home prices surged for the eighth month in a row. While sales activity remained flat between September to October, year-over-year activity rose a robust 12.9%, while the national average home price rose 5.8% to $525,000. As well, the MLS Home Price Index, which measures the overall value of homes sold, inched up 1.8% year over year, signalling a greater proportion of higher-priced housing stock is contributing to sales.
Home Sales and Prices Continue to Rise Year over Year
According to the Canadian Real Estate Association, national sales activity is now 20% above its low this past February, and just 7% shy of the peak it reached in 2016 and early 2017, with annual transactions up in 80% of all local markets, including Canada’s largest cities.
Performance was more mixed over the short-term, however, with half of all markets experiencing a decline in sales from September. As well, these slower locales continue to be impacted by the mortgage stress test that was implemented in early 2018, creating buyers’ market conditions in those cities, which CREA President Jason Stephen says is masked by the cheerier overall national picture.
“Steady national activity in October hides how the mortgage stress test remains a drag on many local markets where the balance between supply and demand favours home buyers in purchase negotiations,” he stated.
Gregory Klump, CREA’s chief economist, concurs, saying, “It’s a full-blown buyers’ market or on the cusp of one in a number of housing markets across the Prairies and in Newfoundland. Home buyers there have the upper hand in purchase negotiations and the mortgage stress test has contributed to that by reducing the number of competing buyers who can qualify for mortgage financing while market conditions are in their favour.”
New Listings Continue to Decline
The national level of new listings also continued to decline, led by the steepest drops in the Greater Toronto Area and Ottawa markets, further tightening market conditions there. As a result, the national sales-to-new-listings ratio – a measure that indicates the level of buyer competition within a market – rose to 63.7%, meaning the national housing market can be classified as a sellers’ market. (According to CREA, a ratio that falls within the 40 – 60% range refers to a balanced market, with below and above that threshold signalling buyers’ and sellers’ markets, respectively.) The current ratio also sits well above the long term average of 53.6%, meaning buyers are facing tougher market conditions than usual.
However, there’s lots of variation at the local level; Alberta, Saskatchewan, and Newfoundland and Labrador remain in buyers’ market territory, while two-thirds of all other markets can be considered balanced, including British Columbia’s Lower Mainland region.
Level of Inventory Lowest Since April 2017
As well, the total months of inventory – a measure that refers to the amount of time it would take to totally sell off all remaining homes for sale – sits well below its long-term average of 5.3 months at 4.4 months – the lowest level since April 2017. Overall, that’s making the market more favourable for sellers, with less selection to go around for those on the house hunt. Again, however, this remains varied at the local level, with inventory in the Prairies and Newfoundland and Labrador far above average levels, and far below in Ontario, Quebec, and the Maritimes.
Prices Are Stabilizing in Some Markets
However, there has been recent price stabilization in these regions, following months of bleeding values, especially among homes for sale in Vancouver, which had sustained a steep policy-induced slump over the past year. While prices are still down year over year, the declines are less steep than before, down -6.4% in the Greater Vancouver Area, and down -4.2% in the neighbouring Fraser Valley. Vancouver Island, Okanagan, and Victoria all saw home prices rise, up 3.1%, 2%, and 0.5%, respectively.
It was a similar picture across the prairies with prices for Saskatoon, Edmonton, and Calgary real estate declining between -1.5% to -2.5%, though prices fell more steeply in Regina at -6.5%. However, price growth remained strong across the Greater Golden Horseshoe, as well as for sold home prices in Toronto, Ottawa, Montreal, and Moncton.
All benchmark home types also saw gains with the largest increase in the two-storey single-family house segment, which rose 2.5%. That’s followed by a 1.4% increase for one-storey single-family houses, townhouses up 1%, and apartments up 2%.
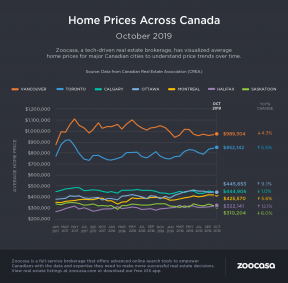
Check out the infographic below to see how home prices performed in major markets across Canada in October :
CREA : Canadian Home Sales and Prices Up for Eighth Month in a Row in October by Penelope Graham | zoocasa
Recent Comments