Canada’s real estate market slowed down considerably since COVID-19 measures were introduced across the country in March. With public health and safety top of mind, a number of real estate associations (like the Ontario Real Estate Association and BC Real Estate Association), put forth guidelines for realtors to prioritize virtual communications over any in-person meetings. Such physical distancing measures in tandem with broader economic uncertainty pushed many buyers and sellers to the sidelines, as they await more stability.
In addition to record declines in sales activity across the country, the latest data from the Canadian Real Estate Association (CREA) for April – which is the first full month after COVID-19 measures were implemented across the country – reveals that the average home price in Canada is now $488,203. This price is 10 per cent lower than the average home price of $539,724 in February, which was well before any COVID-19 measures were introduced at the federal or provincial level.
To get a snapshot of how the market activity shifted in the short run since COVID-19 measures were introduced across Canada, Zoocasa used data from CREA to compare average home prices and sales between February and April 2020 for 20 real estate markets across the country. Average home prices were used as this is the price metric used and most widely available across regions in official monthly reports from CREA. As always, our analysis serves to provide a high-level overview of market dynamics and a broad perspective on market activity. Prospective home buyers will benefit from a more detailed analysis of price and sales trends for specific home types of interest or at the city, town, or neighbourhood level.
Canada Moves Into Balanced Market Territory, From Sellers’ Market
In terms of buyer competition, at the high level, the Canadian housing market shifted from sellers’ territory toward more balanced market conditions, as indicated by the monthly sales-to-new-listings ratio (SNLR). In April, Canada’s SNLR was 58%, down from 62% in February 2020. For reference, a range between 40% – 60% indicates balanced conditions, while below and above that threshold indicate local housing market conditions favouring buyers and sellers, respectively.
Overall home sales in Canada were down 46%, dropping to 20,630 in April from 38,161 in February. Similarly, new listings dropped 42% in April, down to 35,795 from 61,816 in February.
Greater Toronto, Hamilton-Burlington, Niagara Region and Kitchener-WaterlooMove Into Balanced Market Territory
At the regional level, four housing markets shifted from sellers’ to balanced territory – notably, all these markets are in Ontario. While each of these areas experienced a drop in sales of at least 50% in April from February, the corresponding decrease in new listings only ranged from 29% to 42%, thus resulting in theoretically more buyer-friendly market conditions
The Greater Toronto market moved from an SNLR of 68% in February to an SNLR of 48% in April, putting it firmly in balanced market territory. Home sales were down 59% in April from February, while new listings only dropped 42%. Kitchener-Waterloo (K-W) followed a similar trend – moving from an SNLR of 75% in February to 54% in April, meaning buyers faced less competition for new listings in April than they did in February. Home sales in K-W fell 51% but new listings only dropped 32%.
The Hamilton-Burlington area experienced a 52% decline in sales in April from February, but only a 32% drop in new listings; pushing the SNLR to the edge of a balanced market at 58% from being a sellers’ market at 73% in February. Niagara Region’s market conditions changed from being firmly in a sellers’ market with an SNLR of 70% in February to 44% in April after a 55% decline in sales.
Ontario Cities See Largest Decline in Average Home Price Dollar Value
Our analysis further revealed that Ontario regional markets led the country when it came to average price declines – claiming the top five spots when ranked by dollar declines.
The Greater Toronto average home price dropped a staggering $88,898 between February and April, marking a 10% decline to $821,392 in April as reported by CREA. This was followed by Ottawa, where home prices declined by $34,652 from $510,139 in February to $475,487 in April 2020. Rounding out the top three was Hamilton-Burlington, where a $32,255 decline marked a 5% decrease in the average home price to $614,412 in April.
Niagara Region and Windsor-Essex saw average home prices decline $31,467 and $30,661 respectively since COVID-19 measures were introduced in March. The average home price in Niagara in April was $457,026 and in Windsor-Essex, was $345,771.
Out of the five markets with the largest average price drops, Ottawa and Windsor-Essex experienced the lowest decline in sales at 21% and 30% respectively. In comparison, Greater Toronto, Hamilton-Burlinton and Niagara Region home sales halved from February with drops of 59%, 52% and 55%, respectively.
BC Housing Markets See Consistent Sales Declines; Varying Impact on Average Prices
In all three BC markets studied, roughly half the number of homes sold in April, compared to February. In Victoria and in Fraser Valley, home sales declined 48%, whereas in Greater Vancouver there were just 1,119 sales in April; 49% lower than the number of sales in February.
Despite the consistent rate of decline in sales for each of these markets, there was a diverging impact on average home prices. In Greater Vancouver, home prices grew 2% between February and April from $1,006,708 to $1,031,321 (a $24,613 increase). On the other hand, the average home price stayed flat at $769,666 in Fraser Valley and also remained unchanged in Victoria at $701,632.
Canada’s Biggest Regions Experience the Worst Sales Declines
Across Canada, home sales were slashed nearly in half between February and April. More specifically, 20,630 homes changed hands in April compared to 38,161 in February, marking a 46% decrease in sales.
Regionally, some of Canada’s largest markets experienced a rate of sales decline that outpaced the national average. Canada’s largest housing market – Greater Toronto – noted substantial declines in both average home price and sales. Sales in particular dropped 59%, with 2,975 versus 7,256 in April. Similarly, Hamilton-Burlington and Niagara also noted sales declines of 52% and 55% each.
Montreal, one of the regions most affected by the coronavirus that causes COVID-19, was also most impacted when it came to a decline in sales. Sales dropped a whopping 65% between February and April from 5,338 to 1,890. Average home price declined at a much slower rate, dropping $5,125 to $434,720 in April. Elsewhere in Quebec, sales followed a similar trajectory. In Quebec CMA, sales declined 64%, but the average home price rose 1% to 277,075. In Gatineau, although the average home price rose by 4% to $295,175, sales dropped a dramatic 59%.
Calgary, a market already experiencing a slowdown in recent years, saw a 49% drop in sales from 1,521 in February to 776 in April. The average price fell by -$27,960, or 6%, to $409,318, hitting the lowest average price in the past five years.
Here’s a snapshot of how average home prices and sales changed in 20 regional markets across Canada between February and April 2020. Further below, you’ll find roundups of the markets with the largest dollar increases and decreases in average home price and those with the most and least significant decreases in sales volumes during this period.
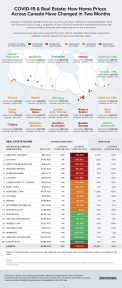
Markets With The Largest Dollar Drop in Average Price
1. Greater Toronto
April 2020 price : $821,392
Change in price from Feb 2020 : -$88,898 (-10%)
April 2020 sales : 2,975
Change in sales from Feb 2020 : -4,281 (-59%)
2. Ottawa
April 2020 price : $475,487
Change in price from Feb 2020 : -$34,652 (-7%)
April 2020 sales : 920
Change in sales from Feb 2020 : -244 (-21%)
3. Hamilton-Burlington
April 2020 price : $614,412
Change in price from Feb 2020 : -$32,255 (-5%)
April 2020 sales : 482
Change in sales from Feb 2020 : -516 (-52%)
Markets With The Largest Dollar Increase in Average Price
1. Saskatoon
April 2020 price : $327,539
Change in price from Feb 2020 : +$29,815 (+10%)
April 2020 sales : 283
Change in sales from Feb 2020 : -31 (-10%)
2. Greater Vancouver
April 2020 price : $1,031,321
Change in price from Feb 2020 : +$24,613 (+2%)
April 2020 sales : 1,119
Change in sales from Feb 2020 : -1,066 (-49%)
3. Winnipeg
April 2020 price : $313,022
Change in price from Feb 2020 : +$20,952 (+7%)
April 2020 sales : 739
Change in sales from Feb 2020 : -26 (-3%)
Canadian Markets With The Largest Percentage Drop in Sales
1. Montreal CMA
April 2020 price : $434,720
Change in price from Feb 2020 : -$5,125 (-1%)
April 2020 sales : 1,890
Change in sales from Feb 2020 : -3,448 (-65%)
2. Quebec City CMA
April 2020 price : $277,075
Change in price from Feb 2020 : +$2,953 (+1%)
April 2020 sales : 403
Change in sales from Feb 2020 : -705 (-64%)
3. Greater Toronto (tied)
April 2020 price : $821,392
Change in price from Feb 2020 : -$88,898 (-10%)
April 2020 sales : 2,975
Change in sales from Feb 2020 : -4,281 (-59%)
3. Gatineau CMA (tied)
April 2020 price : $295,175
Change in price from Feb 2020 : +$10,095 (+4%)
April 2020 sales : 193
Change in sales from Feb 2020 : -279 (-59%)
Markets With The Smallest Percentage Drop in Sales
1. Winnipeg
April 2020 price : $313,022
Change in price from Feb 2020 : +$20,952 (+7%)
April 2020 sales : 739
Change in sales from Feb 2020 : -26 (-3%)
2. Regina
April 2020 price : $299,896
Change in price from Feb 2020 : -$2,756 (-1%)
April 2020 sales : 171
Change in sales from Feb 2020 : -10 (-6%)
3. Saskatoon
April 2020 price : $327,539
Change in price from Feb 2020 : +$29,815 (+10%)
April 2020 sales : 283
Change in sales from Feb 2020 : -31 (-10%)
Methodology
Home prices and sales were sourced from the official Canadian Real Estate Association (CREA) monthly reports for April and February 2020.
How Much Home Prices and Sales Dropped Across 20 Canadian Markets Due to COVID-19? by zoocasa
Recent Comments